
Capacity Planning for Service Businesses: How Systems Prevent Growth From Breaking Delivery
A service business closes its best sales month. Then it delivers its worst quarter.
Sales sees revenue. Delivery sees hours, skills, deadlines, and work already promised.
Capacity planning for service businesses joins those two views before the deal is signed. Qualified deals create a likely workload. Signed deals reserve real capacity. Live projects use it up.
When forecast demand crosses an agreed limit, the system alerts a named owner. The decision starts there.
Without the link, growth reaches delivery as a surprise. The response is overtime, rushed hiring, late starts, cut scope, and founder rescue work.
Industry data frames the gap. Deltek reports that deal pipeline coverage rose to 175 percent of the quarterly bookings forecast for 2025. Billable utilization fell to 66.4 percent, the lowest level SPI Research has on record.
Demand is not the shortage. Translation is.

Why Capacity Planning for Service Businesses Is a Revenue System
Every closed deal creates future work. The work arrives with a role, a skill, a start date, and a deadline.
Sales forecasts revenue. Delivery needs a forecast of the workload behind the revenue. Most service firms build the first and skip the second.
Capacity planning for service businesses compares expected demand for services with actual supply. Supply means the people, skills, time, and delivery windows on hand.
Check capacity after signing, and the cheap options are gone. Before signing, a start date can be moved for free. After signing, the same move costs the client trust.
The 2026 benchmark data makes the pattern commercial. Deltek summarized the 2026 SPI benchmark results from more than 500 firms. Three numbers sit together.
- Deal pipeline coverage climbed to 175 percent of quarterly bookings forecast, up from 166 percent.
- Billable utilization fell to 66.4 percent, the lowest in SPI Research history, against a 75 percent optimal mark.
- On-time project delivery held at 73.8 percent, below its 76 percent five-year average.
Demand coverage went up. Delivered work went down. The constraint sits between the two.
A full pipeline is not proof the business is ready to deliver the work.
Why this matters: Capacity risk sets start dates, client expectations, and project margin. It also sets staff load and the work bouncing back to the founder.
Why Capacity Planning for Service Businesses Fails in Separate Tools
The data exists. The data lives in five places.
The CRM holds deal value and odds. The project tool holds assigned work. Timesheets hold the past. Calendars hold leave. Scope documents describe effort in prose, never as structured demand.
Four failures follow.
- Sales agrees dates and scope with no view of delivery limits.
- Operations sees likely work only once the deal turns urgent.
- Headcount gets read as usable capacity, because internal work and manager time stay hidden.
- Reports go stale, because project, date, and role data is kept in several systems.
Two definitions split the honest view from the hopeful one.
Delivery demand is the role-based hours, skills, and timing required by live work, signed work, and qualified pipeline deals.
Available capacity is the delivery time left after planned leave, internal work, manager time, and promised work are removed.
Deltek notes firms running disconnected point tools report weaker visibility, more manual workarounds, and slower decisions.
Ask three people for the delivery load in week nine. Expect three answers. None of them is wrong, because each one reads a different system.
The same split drives the cost of disconnected tech stacks. It also widens the gap between CRM reporting and reality.
The missing piece is not another dashboard. The missing piece is a decision workflow built on joined-up data.

The Capacity Control Loop Behind Capacity Planning for Service Businesses
Creativz runs this as a loop with five stages. Each stage hands the next one something usable.
1. Forecast demand
Bring live work, signed work, and qualified pipeline into one forward view. Keep odds and expected start date on every line. A weighted forecast beats a confident guess.
2. Translate scope
Turn each service into hours, roles, skills, timing, and links between tasks. Revenue alone never describes delivery demand.
A sixty-thousand-dollar build and a sixty-thousand-dollar retainer use different people in different weeks.
Microsoft explains the same idea in its resource management guidance. Resource needs come from task assignments, and required skills get matched against the skills on hand.
3. Compare capacity
Subtract promised work, planned leave, internal duties, and a protected buffer from role-based supply. The buffer is not slack. The buffer is review time, recovery time, and room for change requests.
4. Trigger a decision
Alert one named owner when demand exceeds a limit or a required skill is blocked. The alert starts a set workflow, not a debate about whose problem it is.
5. Learn from variance
Compare forecast demand with real work, utilization, project margin, and delivery results. Update the estimates and the limits. The loop closes here, or the loop is decoration.
The Data Model Behind Capacity Planning for Service Businesses
The system matters more than the platform. Every input needs one source, one update rule, and one named owner.
| System input | Required fields | Update rule | Owner |
|---|---|---|---|
| Qualified pipeline | Odds, value, service, start window | Sync when stage, date, or scope changes | Sales owner |
| Sold work | Scope, roles, estimated hours, dates | Reserve capacity after signature | Delivery lead |
| Live workload | Assignments, remaining hours, task links | Refresh from the project system | Project owner |
| Team supply | Role, skills, availability, leave, internal time | Refresh weekly and after staffing changes | Operations |
| Actual results | Hours, margin, delays, scope variance | Close the loop after each milestone | Finance and operations |
Look at the owner column. Data with no owner goes stale. A stale capacity view does more harm than no view, because people still trust it.
What Automation Should Do in Capacity Planning for Service Businesses
Automation removes update work. It scores risk the same way every time. It routes decisions to people. It does not pick the response.
| Automate | Keep human-owned | Reason |
|---|---|---|
| Sync deal, project, and availability data | Approve sources and field rules | Bad inputs create false precision |
| Turn standard services into role-based demand | Review nonstandard scope | Custom work needs judgment |
| Score 30, 60, and 90-day capacity gaps | Choose the planning assumptions | Odds and timing change the result |
| Alert the owner when a limit is crossed | Select the response | The right action depends on clients and strategy |
| Record forecast against actual variance | Change estimates and policy | Learning needs an accountable decision |
A capacity chart built on old scope models returns confident, wrong answers.
Why this matters: Automation buys an earlier warning. The decision remains commercial, and commercial decisions need a human name attached to them.
Capacity Planning for Service Businesses Needs Decision Thresholds
A dashboard reports. A system decides.
A capacity threshold is the point at which forecast demand requires a management decision. The decision moves the start date, changes the scope, shifts the work, adds people, or slows sales.
| Signal | Example threshold | Workflow started | Decision owner |
|---|---|---|---|
| Role overload | Demand beats safe supply for two periods | Review dates, assignments, and hiring need | Operations lead |
| Skill bottleneck | One skill blocks several likely projects | Cross-train, contract, or resequence | Delivery lead |
| Start-date clash | Sold and likely work share one window | Confirm priority before the promise | Revenue and delivery |
| Estimate variance | Real effort keeps beating the estimate | Update the scope model and pricing input | Service owner |
A limit is not a red cell on a chart. A limit is a promise about what happens next.
Set the limits before the quarter starts. Limits agreed under pressure get talked away.
Capacity Planning for Service Businesses Works in 30, 60, and 90-Day Views
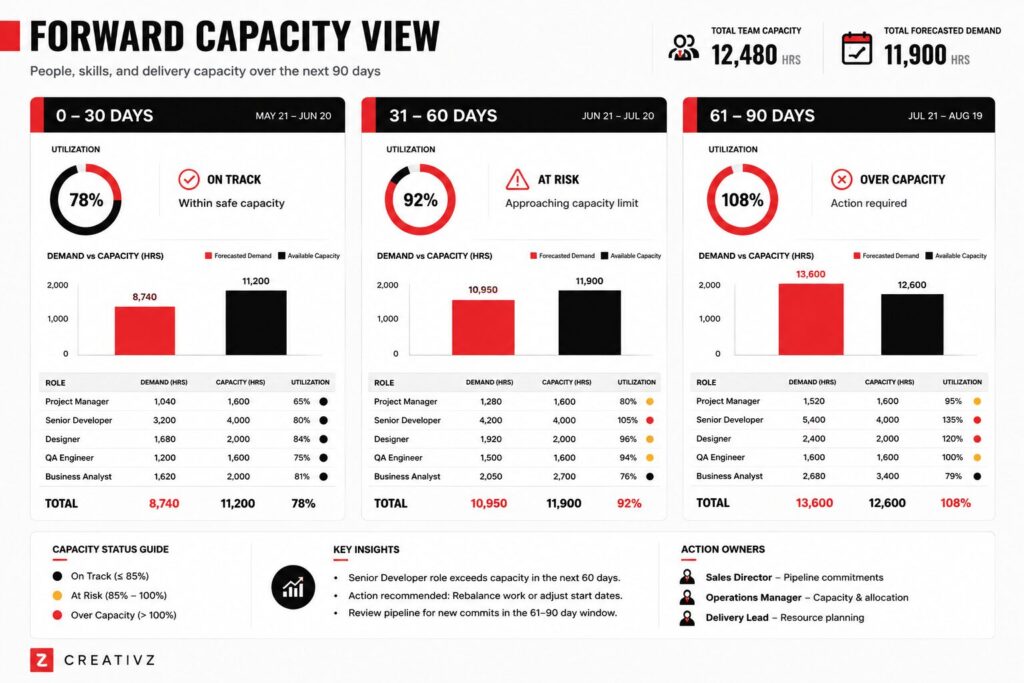
- The 30-day view protects delivery already in motion. It covers assignments, deadlines, leave, and recovery.
- The 60-day view prepares for signed work and strong pipeline. It drives sequencing and short-term staffing calls.
- The 90-day view tests hiring, contractors, cross-training, pricing, and sales limits before the gap turns urgent.
Every view splits by role and service line. A company-wide percentage hides the person blocking the work.
Picture a twelve-person firm at 74 percent utilization overall. The number reads healthy.
Underneath it, one senior integration lead sits at 110 percent for six straight weeks. Four sold projects wait on the same person.
The company-wide figure never shows the queue. The role view shows it in one screen. These numbers are an example, not benchmark data.
Metrics for Capacity Planning for Service Businesses
Utilization is a late measure of a decision made weeks earlier. High utilization also leaves no room for managing, checking, or fixing. Deltek splits billable and non-billable time for the same reason.
Forecast accuracy is the gap between expected demand and the work entering delivery. Measure it by role, period, and service line.
| Metric | What it reveals | Decision it should inform |
|---|---|---|
| Forecast demand by role | Where future work piles up | Hiring, contracting, cross-training |
| Available capacity by role | Safe work the team is equipped to accept | Sales dates and project order |
| Forecast accuracy | Whether assumptions match incoming work | Odds and estimate changes |
| Estimate variance | Where scope models understate effort | Pricing and service design |
| Delivery buffer | Room for review, recovery, and change | Commitment limits |
| Project margin | The commercial result of staffing and scope | Portfolio and offer decisions |
Why this matters: Estimate variance turns an operations detail into a pricing input. Leadership teams act on pricing.
Capacity Planning for Service Businesses Checklist
Run this against your current setup in under fifteen minutes.
- Every core service has a role-based scope and effort model.
- Qualified deals carry an expected start window and a delivery profile.
- Signed work reserves capacity before kickoff planning begins.
- Available capacity removes leave, internal work, manager time, and a protected buffer.
- The view separates roles and skills rather than using a single company-wide percentage.
- Limits start a named workflow with one decision owner.
- Sales sees delivery risk before promising dates or custom scope.
- Forecast demand is compared with real work and project margin.
- Automation keeps data cup to date while people approve commercial and staffing cdecisions
Any unchecked line is future rework. Write the owner beside it this week.
Want to Go Deeper on Capacity Planning for Service Businesses
- 5 Signs Your Business Operations Cannot Scale. The symptoms show up before a capacity system exists.
- The Cost of Disconnected Tech Stacks. Why do demand and supply data drift apart across tools.
- Why Your CRM Reporting System Does Not Match Reality. The data trust problem under every capacity forecast.
Final Thought on Capacity Planning for Service Businesses
Growth breaks delivery when demand arrives without translation, limits, or an owner. A joined-up capacity system buys time to choose.
The business decides before a client deadline, an overloaded lead, or a margin problem does.
The order matters. Translate scope into role-based demand. Compare demand with honest supply. Set the limit. Name the owner.
If your sales plan and your delivery capacity live in separate views, book a Digital Growth Audit. We will map the system between them.
Prefer a self-guided start? The Revenue System Scorecard shows where your revenue system loses time before delivery sees the work.

Creativz.io
Creativz.io is a digital growth consulting firm that builds revenue infrastructure for B2B founders scaling from $500K to $10M ARR. The team architects conversion systems, CRM pipelines, lead-nurture automation, and analytics infrastructure that turn website traffic into predictable revenue. Creativz has worked across construction, SaaS, fintech, B2B services, and logistics, with a focus on systems that scale without scaling headcount.
