Digital Growth Audit: How to Audit Your Business in 90 Minutes
Most founders already have a gut that something is off with their business. Revenue hits a ceiling. Leads come in, but do not close. The team works hard, but the results do not match their effort. Usually, many small problems add up instead of one big issue.
Before Creativz starts any project, we run a digital growth audit across six areas. This 90-minute process usually finds the same issues for businesses earning $1M to $10M in revenue. You can use this method for your own business.
This post shares that same framework. You can work through it on your own. By the end, you will know exactly where your growth system leaks and which fix to start with.
This digital growth audit checks six areas: tech stack, CRM health, lead response speed, funnel conversion, email setup, and revenue tracking. After you review each area, you will find clear next steps to improve.
One important note before you start: be brutally honest. The answers almost always show up in your own data.

What You Need Before Starting Your Digital Growth Audit
Before you start, collect these six types of information. Having them ready saves time and helps you get accurate answers.
- Access to your CRM or pipeline tool
- Your website analytics (Google Analytics, Hotjar, or equivalent)
- Your email marketing platform and the last 30 days of send data
- A list of your current tech tools and what each one costs per month
- Your last 90 days of revenue by source, if you track it
- A rough sense of your average deal size and close rate
If you cannot find most of these in less than 10 minutes, that is a finding in itself. It means your data is not in one place, and you make decisions by guessing.
Area 1: Tech Stack Health (15 minutes)
First, check your basic setup. Do your tools connect and work together, or do they stand alone?
Most businesses earning $2M to $5M use tools designed for smaller companies. They keep adding more tools over time. This causes data to stay in separate places, so founders fill in the gaps by hand. If this sounds like your business, read about the illusion of productivity before you continue.
What to check
- Write down every tool you pay for. Include tools your team uses, even if only sometimes.
- Mark which tools connect to each other, either directly or with tools like Zapier, Make, or an API.
- Find and write down every time you enter the same data into more than one tool. List each time this happens.
- Make a note of any tools you still pay for, but nobody uses anymore.
What the numbers tell you
| Tools | What it likely means | First action |
| 1 to 5 | Lean stack, possible capability gaps | Map what each tool covers and where gaps exist |
| 6 to 12 | Common range, integration is the key question | Audit which tools talk to each other and which do not |
| 13 or more | Almost certainly overlapping and expensive | Consolidate first. Integration second. |
The goal is not to have fewer tools, but to have tools that work together. Eight connected tools are better than fourteen separate ones.
Once you know which tools connect, look at how they help with your leads. Now you can check your CRM and pipeline health.
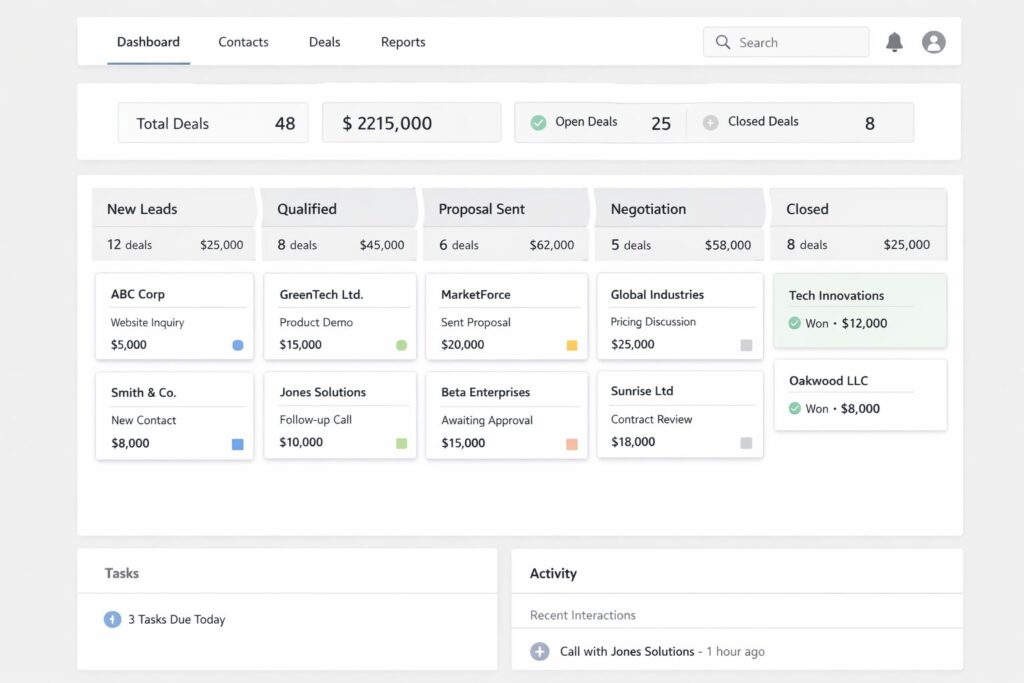
Area 2: CRM and Pipeline Health (15 minutes)
A CRM that nobody trusts is worse than not having one at all. It makes you feel confident for no reason. The pipeline looks full, and deals look active, but when the quarter ends, the numbers don’t match your expectations.
Check these things directly in your CRM. It takes about 15 minutes and shows you the real state of your revenue operation.
What to check
- Open your CRM pipeline. Count how many deals have not moved to a new stage in more than 30 days. Write down this number.
- Look at your last 10 lost deals. Check if you wrote down why each deal was lost. Make sure the reasons are clear and specific. Write down any that are unclear or too general.
- Find out how new leads enter your CRM. Is it by hand, through a form, or automatically from email? Write down any steps that are missing or do not work the same every time.
- Find out who follows up after demos or discovery calls. Check if reminders or tasks happen automatically. Write down what you find.
- Check how many deals you closed in the last 90 days. Compare how fast deals move through your pipeline to how much money you actually made. Write down any differences.
Red flags that show up in almost every audit
- Deals sit at the same stage for 45 days or more with no activity notes.
- No automated follow-up sequence after a call. Follow-up depends entirely on the rep or the founder.
- Contact records lack key details such as company size, industry, or revenue. You cannot score leads you do not know well.
- Loss reasons say only “not interested” or “went with competitor” with no extra details. This does not help you learn. It is like hitting a blank wall.
If your pipeline accuracy is below 70%—meaning deals you think will close actually do not—your CRM is just a filing cabinet, not a tool for making money.
Once you know the status of each lead in your CRM, check how fast your team answers when a new lead comes in.
Area 3: Lead Response and Follow-Up Speed (10 minutes)
Founders lose the most revenue in this area without knowing it. Research shows: if you answer a lead within 5 minutes, that lead is 21–100 times more likely to buy than if you wait 30 minutes. After one hour, the chance drops by more than 80%.
Most businesses take hours, sometimes days, to respond to leads. This slow response explains why many leads do not convert, even more than problems with your website or message. To learn why speed matters more than better marketing, read the full post on this topic.
What to check
- Find your last 20 inbound leads. Write down how long it took to respond to each one, in minutes or hours.
- Does your system automatically send a reply to a new lead within 60 seconds of them reaching out?
- After you first reply, how many times do you follow up before you decide a lead is cold? What makes you send each follow-up?
- How many leads go cold each month because nobody followed up more than two times?
What good looks like
Under 5 minutes: your system sends an automatic reply with a clear next step
Under 1 hour: a real person or a custom message follows up
Day 2, Day 4, Day 7: you send planned follow-up messages
Day 14 and Day 30: you send messages that keep the conversation going
If you rely on someone remembering to do any of this, it will not happen every time. Do not try to fix it by asking people to try harder. Fix it by setting up automation.
Speed does more than show good manners. It helps you earn more money. It shows your business works fast and well. This makes people trust you more.
Speed helps you start talks with leads. But how you move people through your funnel determines whether they buy from you. Let’s look at your funnel and how you turn leads into customers.

Area 4: Funnel and Conversion Integrity (20 minutes)
This part will take the most time because you need to look at real numbers for each step. You want to see where people drop out of your funnel and why.
Most founders think their website is the cause of their conversion problems. Usually, it does not. The biggest leak is almost always between the first contact and the sale.
What to check
- Open your website analytics. Look at the bounce rate for your homepage and main landing page. If it is more than 70%, your message does not match what people expect.
- Find where people stop between filling out a form and booking a call. What percent of people who fill out a form set up a call? If it is less than 40%, you need to make these steps easier to follow.
- Check how many people who book a call actually show up. If more than 20% do not show up, you are not explaining the value of the call well enough before the meeting.
- Look at how many people buy after a discovery call. If less than 20% buy, you may have a problem with finding the right customers, explaining your offer, or following up.
- Check if you use micro-conversions to get leads interested, like free downloads, tools, or email sign-ups. These help people show they are interested before they are ready to buy.
The conversion benchmark by stage
| Stage | Healthy benchmark | If below this |
| Homepage to lead | 2 to 5% | Message clarity or CTA visibility problem |
| Lead to booked call | 40 to 60% | Friction in the booking process or lack of urgency |
| Booked call to show | 75 to 85% | Pre-call nurture sequence is missing or weak |
| Discovery to close | 20 to 35% | ICP mismatch, offer clarity, or follow-up gaps |
Most leads who do not buy right away are not lost. They just are not ready yet. This is why your email setup matters. Let’s look at how your emails keep people interested until they are ready to buy.
Area 5: Email and Nurture Infrastructure (15 minutes)
Email brings the most return for your money, but most businesses do not use it well. They do not send the right emails at the right time or in the right order.
This audit is not about open rates. It is about whether your email setup helps you sell, even when you are not working.
What to check
- Do you have an automatic welcome series for new leads? If yes, how many emails do you send, over how many days, and does each email have a clear purpose?
- If leads do not book a call within 7 days, do you put them in a nurture series, or do you let them go cold?
- What is your average open rate for the last 30 days? If it is under 20%, you may have problems with your emails being delivered or being interesting enough.
- When did you last email your list? If you do not email your list for more than 60 days, your list will lose quality quickly.
- Do you have a way to re-engage people who have not responded in a while? If not, you are missing chances to make money from contacts you already have.
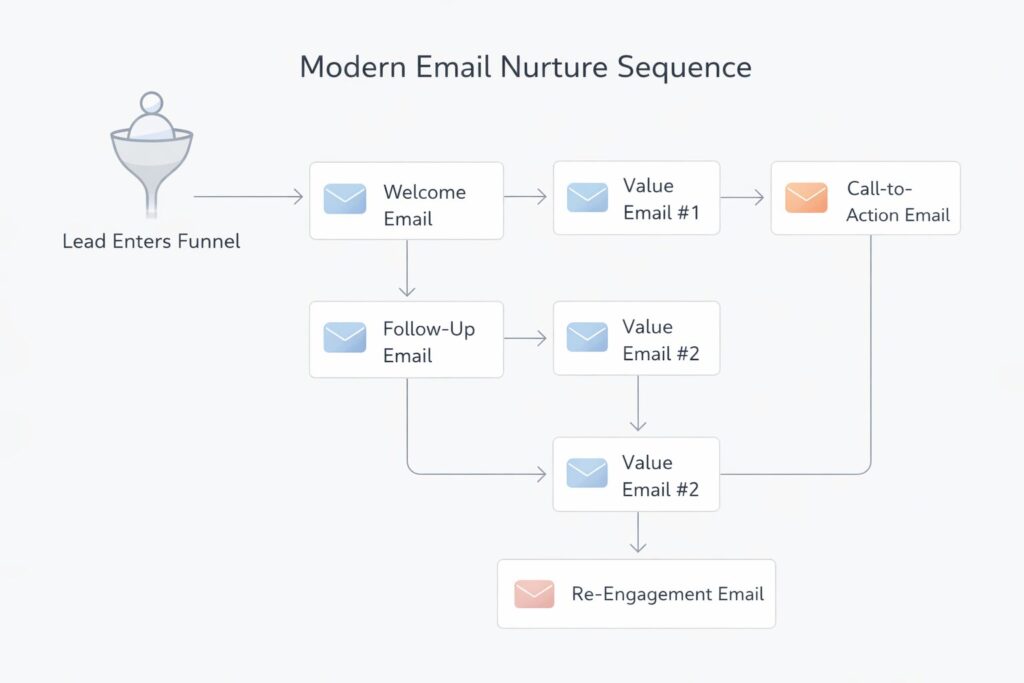
The three sequences every business needs
- Welcome sequence (Days 1 to 14): helps people trust you, shows you can deliver, and invites them to talk with you.
- No-show or no-book sequence (Days 7 to 21): follows up with people who showed interest but did not take the next step.
- Re-engagement sequence (for contacts inactive 60 or more days): asks a clear question, offers something helpful, or asks if they still want to hear from you.
If you only use your email platform for newsletters and single emails, you are using only about 20% of its power to help you make money.
Now that you can see your tech and process setup, the last step is to check if you can clearly see the results. Analytics and revenue tracking help you do this.
Area 6: Analytics and Revenue Attribution (15 minutes)
Most founders cannot see what is happening here. The data exists, but it is not connected, and nobody set up reports to show it.
This part asks a simple question: Do you know which channels and actions bring in your revenue?
What to check
- Can you see right now which sources brought you your last 10 paying customers?
- Do you know how much it costs to get a customer from each channel?
- Does your analytics system track when you complete a goal, not just when people visit a page? For example, does it track when someone fills out a form, books a call, or makes a purchase?
- Can you track a deal from first contact to sale in a single report, or do you have to gather data from multiple systems by hand?
- Do you have a revenue dashboard that your team checks every week?
The minimum viable analytics setup
You do not need a fancy reporting tool to get useful data. Here is the basic setup you need to help you make decisions:
- Google Analytics 4 with events firing for every conversion action
- UTM codes on every paid and social link, so you know where your leads come from
- CRM pipeline reports that show where leads come from, what stage they are in, and how long they take to close
- A weekly revenue summary: new leads, calls booked, proposals sent, and deals closed
If it takes more than 5 minutes to answer, “Which channel made the most revenue this month?” your tracking is broken. That means you are guessing how to spend your marketing money.
The Master Checklist: Your 90-Minute Digital Growth Audit at a Glance
Use this table as your working document. Print it, open it in a second tab, or copy it into a Google Sheet. Tick each item as you go.
| Area | What to check | What good looks like |
| Tech | Count your tools. Map which are integrated. | Fewer than 12 tools, majority connected with live data flow |
| Tech | Find tools nobody logs into. | Every tool has an active use case and an owner |
| CRM | Count deals stalled over 30 days. | Less than 20% of pipeline inactive for more than 30 days |
| CRM | Check if loss reasons are recorded with detail. | Loss reasons are specific and trackable by category |
| CRM | Find where manual data entry is happening. | Lead entry is automated from all primary sources |
| Speed | Measure actual lead response time. | Under 5 minutes for automated acknowledgment |
| Speed | Check follow-up sequence depth. | Minimum 5 touches across 30 days post-inquiry |
| Funnel | Check homepage and landing page bounce rates. | Under 60% bounce rate on primary conversion pages |
| Funnel | Measure lead-to-call booking rate. | 40% or more of form submissions book a call |
| Funnel | Check call show-up rate. | 75% or higher show rate from booked calls |
| Confirm welcome sequence exists and is active. | Minimum 5 emails over 14 days for new leads | |
| Check open rate for last 30-day period. | 20% or higher open rate across the active list | |
| Verify re-engagement sequence for cold contacts. | Sequence triggers automatically after 60 days of inactivity | |
| Analytics | Confirm conversion events are firing correctly. | All form submits, bookings, and purchases tracked as goals |
| Analytics | Check if channel attribution is clean. | Revenue traceable to source in under 5 minutes |
How to Score Your Digital Growth Audit
Count the items where your answer is clearly yes. Use this as your baseline:
- 13 to 15: Your infrastructure is solid. Focus on optimization and scale.
- 9 to 12: Foundation is there, but gaps are costing you revenue. Prioritize the two lowest-scoring areas first.
- 5 to 8: Multiple systems are underperforming. Pick the single highest-leverage fix and start there.
- Below 5: The business is running on manual effort and instinct. A full infrastructure rebuild is likely the fastest path to sustainable growth.
The score is not a judgment. It is a starting point. Every business we have worked with has had gaps. The ones that grew fastest knew exactly where the gaps were.
How to Prioritize What Your Digital Growth Audit Finds
The audit gives you a list. The list needs a sequence. Not everything on the list is equally important, and trying to fix everything at once fixes nothing.
Use this prioritization filter:
- Fix the lead response time first. It is the fastest win and the one with the clearest revenue impact.
- Fix CRM health second. Clean pipeline data makes every other decision better.
- Build or fix your email sequences third. Automation compounds over time. The earlier you build it, the more it earns.
- Fix funnel conversion points fourth. Once traffic is captured and properly followed up on, the conversion rate in the middle of the funnel becomes the growth lever.
- Fix analytics last, or at least in parallel with everything else. You need clean data to know if the other fixes are working.
The technology to fix all of this exists. The bottleneck is usually not knowing what to build first.
Want to Go Deeper?
These posts expand on the six areas covered in this digital growth audit:
- The Cost of Disconnected Tech Stacks: How to Build an Integrated Growth Stack — What to do when your tools are not talking to each other.
- Why Your Business Does Not Have a Traffic Problem but a Conversion Problem — The structural diagnosis most founders need before adding any new traffic channel.
- Revenue Infrastructure: Build Predictable B2B Growth — How to connect your marketing, CRM, and sales into one compounding system.
- Email Marketing in 2026: Why Full-Funnel Automation Beats Random Emails — How to turn your email platform into a revenue driver instead of a broadcast tool.
- How AI Agents and Predictive Analytics Are Replacing Manual Revenue Systems in B2B — Where automation is heading and how to build for it now.
- The Illusion of Productivity: Why More Tools Don’t Mean More Growth — Why adding tools without integration makes the problem worse, not better.
- Why Fast Response Time Wins More Deals Than Better Marketing — The data behind why speed is your highest-leverage conversion variable.
Final Thought
Most founders already know something is off. The audit just shows you exactly where.
The six areas in this framework are not complicated. They are the same infrastructure gaps we find across nearly every business doing $1M to $10M in revenue. Disconnected tools. A CRM nobody trusts. Leads are going cold because follow-up depends on someone remembering to do it. Email sequences that stop after two touches. Analytics that track sessions but not decisions.
None of these is unfixable. But you cannot fix what you cannot see.
The 90 minutes you spend running this digital growth audit will give you more clarity on your revenue system than most founders get from a full quarter of guesswork. You will know which area is costing you the most, which fix has
Want Us to Run This Audit For You?
We run a Free Digital Growth Audit for founders doing $1M to $10M in revenue. We go through all six areas, identify your highest-priority leaks, and give you a prioritized fix list.